Calculating fares using the GTFS specification

We’ve just released TransitTimes+ 2.1, and this version shows fare calculations for trips, based on the data specified in the fare_attributes.txt and fare_rules.txt file in agencies’ GTFS feeds.

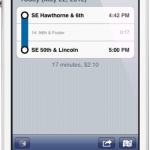
(Fares are shown in footer of the trip description, if made available by the transit agency. In this case, TriMet of Portland supply this data)

Rather than describing the structure of these files, you can read the specification and then read some detailed examples.

If you read these examples, you’ll see that it can be quite complex to calculate a fare, especially when one or more transfers are involved. Here’s how we’ve done it in TransitTimes+:

  1. Find qualifying fares for each segment of a trip, disregarding transfer options
  2. Create every combination of fares possible
  3. Find the cheapest total, this time accounting for transfers

1. Find Qualifying Fares

To determine a qualifying fare for a trip, you must typically know its start and finish stop. When a transit agency includes fare information, they must also include zone information with each stop. If a stop doesn’t have a zone specified, then a fare cannot be calculated.

(Note: technically, some fares don’t rely on zone information, in which case they don’t have corresponding rules in fare_rules.txt. In this case, the zone is not required).

You can then determine qualifying fares using the route_id, origin_id, destination_id and contains_id fields.

It’s important to understand the fare examples (linked above) to see how the contains_id field works, as a trip must pass through the zone IDs as exactly specified in the rules in order to qualify.

2. Create Fare Combinations

At this point, every segment in a trip will have 0 or more fare options associated with it. If it has 0, then it’s not possible to estimate the fare.

Assuming we can calculate the fare, we use a recursive algorithm to build up every combination of fares. For instance, if Segment A has fares 1, 2, 3, and Segment B has 4, 5, 6, our combinations are 1-4, 1-5, 1-6, 2-4, 2-5, 2-6, 3-4, 3-5, 3-6.

3. Find The Cheapest Total

Once you’ve created all fare combinations, this is a case of looping over each combination and calculating the total. Lowest total wins.

When calculating the price, you must account for transfers. Transfers can be time-based (e.g. unlimited usage for 2 hours) or quantity-based (e.g. up to 1 transfer).

There is some ambiguity in the specification about when the transfer time starts (does it begin from start of initial trip, and can the transfer time expire during the subsequent segment?). For these we must make assumptions.

In TransitTimes+, we made the assumption that if the subsequent trip starts before the transfer time expires, then the transfer qualifies.

Conclusion

As you can see, it’s not the easiest thing to calculate fares. GTFS was designed in such a way that most transit agencies can accurately model their pricing scheme in the same generic way.

There are some drawbacks with this system, one which is that there’s no time-based information specified. This is a problem in a city such as Adelaide, where fares are cheaper between 9am and 3pm on weekdays.

Additionally, the whole GTFS fare system is designed around “adult fares” (that is, the full fare - no concessions or discounts). This means it’s not possible to specify different rates for children or seniors.

Also, it’s not possible to account for bulk purchasing of tickets, so when displaying fares using GTFS information it’s generally calculated using the one-off ticket price.

Handling GTFS Blocks Part 1: Introduction

Transit agencies will almost always use each bus/train/tram continuously for an entire service day (or for some portion of it). Because a single trip on a single route may only take 30 minutes or an hour, each vehicle will perform potentially many trips in one day.

In some cases, the vehicle will just go back and forth on the same route. In other cases, once it reaches a certain point it will change its number. Sometimes passengers won’t know the route has changed; other times they will need to disembark and the vehicle may wait 20 or 30 minutes before starting its next trip.

In any case, transit agencies can represent the subsequent trips a single vehicle takes using the block_id field in GTFS. For instance, let’s look at the following screenshots from TransitTimes Adelaide.

This screenshot represents a single vehicle servicing two trips, each of a separate route. The first route (171) finishes at the shown stop, where its headsign number becomes 174.

It’s important as a developer to make use of this information if it is available, since patrons may be confused if your trip planner tells them to change buses if they don’t need to. Unfortunately, not all transit agencies provide this information (such as Transperth), but when the information is available to use we make use of it in TransitTimes!

While this is only an introduction to GTFS blocks, we’ll be posting various articles about good ways to make use of this field based on our experiences with TransitTimes. This will includes strategies for validating blocks, and how to optimize the data for quicker search.

Feed Challenges: Adelaide Metro

Despite the GTFS specification defining how agencies should publish their transit data, every agency has different needs and structures, and therefore use and interpret the specification how it best suits them. Each post in this series discusses how a single agency structures their feed and highlights things to be aware of. It’s also worth noting that GTFS has changed over the years, and once an agency is setup using GTFS, they are typically reluctant to update their feed to reflect spec changes.

The feed from Adelaide Metro was the first that TransitTimes made use of, and therefore is treated is somewhat of a “baseline” feed.

This is also one of the most complete feeds we’ve encountered. That is, it’s required the least amount of massaging to get into a consistent format.

Trip Blocks

Initially, Adelaide Metro did not include block information in their feed, but they worked quickly to include this information. One of them problems with how they included this however, was that they re-used block IDs for unrelated blocks.

To overcome, we now check all trips in a block to ensure the “join” between each trip makes sense. That is, the final stop time of one trip and the first stop time of the next occur near each other (within a threshold of, say, X metres), and they must occur within Y minutes of each.

I’ll be posting on this blog in the future of further enhancements we’ve made to the block system to make searching much faster and simpler.

Time Points

Adelaide Metro include information about timed points in their stop_times.txt file, which is a really good addition, despite not being an official part of the specification.

When transit agencies release timetables, they don’t typically list every single stop in a trip, due to the sheer numbers. Instead, a selection of key stops are listed with times that drivers try to keep to.

This data is included in the feed using an extra column called timepoint. If the stop time represents a timed point on the timetable, the value is 1, otherwise the value is 0.

Note: TransitTimes does not currently make use of timed points but we hope to include this in an upcoming version

Overall Pros

  • Adhere closely to GTFS specification
  • Provide block and direction information
  • Include time point information
  • Provide accurate route colours
  • Use calendar and calendar dates appropriately (many agencies provide excessive records and don’t use these files as intended)

Overall Cons

I can’t really fault this feed. The only thing I would like to see are a few stop naming inconsistencies and various spelling mistakes fixed.

Another addition that would be nice is to use the “parent station” functionality to differentiate between platforms at train stations so TransitTimes users know which platform to head to.

Making GTFS Shape Data Manageable

One of the files that may be included by transit agencies in GTFS feeds is the shapes.txt file. This file is used to describe the various paths that bus or trains (or any route type for that mater) take on their trips.

Every record in shapes.txt corresponds to a single point for a single shape. Some shapes may consist of thousands of points. While it’s awesome that some agencies provide this level of detail, some devices may struggle to represent this data efficiently.

One of the challenges I faced with TransitTimes was the memory constraints of iOS devices. Rendering a polyline with 2000 points is just not feasible using iOS MKMapView.

The following image shows a portion of a shape from Transperth’s GTFS feed. This shape is made up of 400 points (the entire shape is actually 1700 points - I cut this down for simplicity).

As you might imagine, an iPhone 3G struggled immensely trying to draw this map, and once drawn it was almost impossible to actually scroll around the map. (In actual fact, the iPhone 4 also struggled).

This level of detail has no benefit to the user - especially if they can’t interact with their device.

The following image shows the exact same shape, but this time it’s made up of 70 points. This is far more manageable for mobile devices.

To automate this reduction of points, I used the Douglas-Peucker algorithm. This is a recursive algorithm that finds the point furthest away orthogonally from two other points.

The following image demonstrates this.

If this point is within a given tolerance, the point is discarded. If it’s outside the tolerance, the point is kept and the algorithm continues. When it continues, the algorithm is called twice: once for the line connecting the original start point and the new point, and again, this time for the line connecting the new point and the original end point.

I’ve written an article on PhpRiot about implementing this algorithm in PHP: Reducing a Map Path Using Douglas-Peucker Algorithm.

Using this algorithm, I’ve managed to remove upwards of 95% of shape points from GTFS files I’ve processed, without any significant loss of quality.

The other point I haven’t touched on: removing more than 95% of shape data also results in significant savings of space. For instance, the shapes.txt file for Transperth is over 40 MB in size. Reducing this file by 95% would make the file about 2 MB.

What Is GTFS?

Since this blog will dedicate many posts to General Transit Feed Specification - GTFS - let me provide an introduction.

Firstly, from the official documentation:

The GTFS transit feed specification defines a common format for public transportation schedules and associated geographic information.

The “G” in GTFS is commonly thought of as standing for Google, since they created this specification so they can display transit info on Google Maps.

Transit agencies distribute (well, provide a link on their web site typically) to a ZIP file that contains a number of CSV (comma-separated values) files - each of which is described at the above URL.

Agencies distribute updates to their feeds at their own intervals. For instance, Auckland provide one month of data at a time, while others may provide 6 or 12 months worth of data.

The GTFS format isn’t overly strict, meaning:

  • There’s no fixed format for identifiers (such as route_id or trip_id)
  • Agencies tend to omit fields as they please
  • Agencies sometimes add fields that aren’t in the spec (this doesn’t really matter - you can choose to use the extra info provided, or simply have your CSV parser ignore it)
  • Many agencies tend to misuse the calendar.txt and calendar_dates.txt files

There’s no versioning included in GTFS. Each agency has adopted GTFS at different stages of its lifetime, so they build their files. For instance, when Perth adopted GTFS, the direction_id field in trips.txt wasn’t part of the spec. For a given route, “inbound” and “outbound” of the same route are treated as separated entries in the routes.txt file.

In later posts I’m going to discuss some of the various differences and challenges associated with the feeds from the feeds of various cities.

Hopefully this brief introduction gives you some idea of GTFS. It’s a somewhat simple specification, although some aspects are hard to comprehend until you’ve dealt with the data for a while.